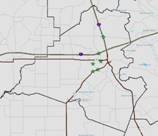
This study analyzes crash data at six intersections in the city of Lafayette, LA, before and after the installation of red-light cameras at each location. The premise for installing cameras at intersections is that the cameras reduce the occurrence of red light running and thereby reduce the likelihood of related crashes. The law enforcement agency in Lafayette uses the LACRASH software, developed by the Highway Safety Research Group at LSU, to report crash information electronically to the state. These crash reports include GPS information, as well as an indicator regarding
 whether the crash occurred at an intersection. The data shows that the total number of crashes occurring at the six intersections declined by 12.6%, from the 12 months prior to the installation of the cameras to the 12 months after installation, it also showed that the number of angle crashes declined by 33.3%, while the number of all other crash types, including rear-end crashes, remained about the same. Crash cost analysis indicated
 | Categories | Fatal | Injury | PDO | Total |
|---|---|---|---|---|
| Change in # of Crashes | 0 | -14 | -2 | |
| Cost per crash | $1,545,134 | $85,180 | $8,328 | |
| Cost savings | $(1,192,520) | $(16,656) | $(1,209,176) | |
| Revenue | $515,250 | |||
| Total savings | $(693,926) |
intersections with no net cost reduction due to the fact that revenues from the cameras far exceeded any crash cost reduction. This decrease is not conclusive evidence that the red-light cameras were the cause of the entire decline in crashes, because from 2007 - 2008 there was a decline in total crashes statewide and intersection crashes specifically and intersections may have been selected for installation because of their high number of crashes in 2007. The analysis suggests that red-light cameras are most beneficial and cost effective at intersections with a high total number of angle crashes. Selecting locations for red-light cameras according to this guideline will help prevent public perceptions that red-light cameras are revenue generators, rather than safety measures. To read the full report click here.
